

Salesforce + GIS Donor Intelligence
Integrating Salesforce, iWave, and Geographic Analytics
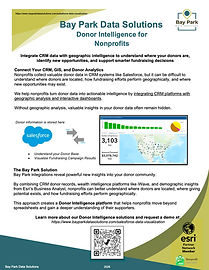
Bay Park helps nonprofits turn Salesforce donor data into actionable fundraising intelligence by combining CRM data, donor wealth insights, and geographic analysis.
By integrating Salesforce with GIS technology, organizations can visualize donor communities, identify high-potential regions, analyze fundraising performance geographically, and plan more effective donor engagement strategies.
Interactive dashboards and geographic analytics help nonprofit teams better understand where their supporters are located and where new opportunities for fundraising may exist.
The Challenge: Donor Data Without Geographic Insight
Nonprofits collect large amounts of donor information in CRM systems like Salesforce, but understanding how that data relates to geography and community demographics can be difficult.
Development teams often ask questions such as:
-
Where are our strongest donor communities located?
-
Which regions have the greatest potential for future giving?
-
How effective are our fundraising campaigns geographically?
-
Where should we focus outreach and relationship-building efforts?
-
How can we better connect program impact with donor engagement?
Without geographic analysis, valuable insights hidden within donor data often remain difficult to discover.
The Bay Park Donor Intelligence Solution
Bay Park integrates Salesforce donor data with geographic intelligence to create powerful visualizations and analytics that reveal new insights into your donor community.
Our solution combines multiple data sources into a unified donor intelligence platform:
-
Salesforce donor records and CRM data
-
Donor wealth insights from platforms such as iWave
-
Geographic analysis and dashboards using ArcGIS
-
Demographic intelligence from Esri Business Analyst
-
Program and impact data from ArcGIS Survey123
These integrations allow nonprofits to visualize donor patterns, discover new fundraising opportunities, and connect program impact with donor engagement.
By transforming donor data into geographic intelligence, organizations can make more strategic fundraising decisions and better understand the communities that support their mission.
Real Donor Intelligence Examples
By integrating Salesforce donor data with geographic intelligence and donor analytics platforms such as iWave, nonprofits can uncover powerful insights that are difficult to see in traditional CRM reports.
Below are examples of how organizations can use geographic donor intelligence to support smarter fundraising strategies.

Identify High-Potential Donor Regions & Hotspots
By combining donor records with demographic insights from Esri Business Analyst, nonprofits can identify communities with strong philanthropic potential.
Mapping donor locations alongside demographic indicators such as income levels, education, and philanthropic engagement can reveal geographic areas where new donor outreach efforts may be most effective.
This helps development teams focus fundraising efforts where they are most likely to succeed.
Optimize Major Donor Travel
Development officers frequently travel to meet with donors, but determining which donors to prioritize and how to plan those trips efficiently can be challenging.
By combining CRM donor records, donor intelligence from iWave, and geographic analysis through ArcGIS, Bay Park helps nonprofits plan more effective donor engagement trips.
Development teams can:
-
Identify high-value donors within a specific region
-
Prioritize visits based on donor potential and giving history
-
Visualize donor clusters around travel destinations
-
Plan efficient routes between donor meetings
This allows development officers to maximize the value of each trip while strengthening relationships with key supporters.
Visualize Fundraising Campaign Results in Real Time
Fundraising teams often wait until the end of a campaign to analyze results. By integrating Salesforce donor data with live dashboards built in ArcGIS, nonprofits can visualize campaign performance as donations are received.

Interactive dashboards allow teams to monitor:
-
Donation activity by geographic region
-
Campaign response patterns across communities
-
Donation totals and trends over time
-
Areas with strong engagement or untapped potential
These real-time insights allow fundraising teams to adjust outreach strategies, focus efforts on high-performing regions, and communicate campaign progress more effectively to leadership and stakeholders.
Request a Demo
See how Salesforce, donor analytics, and geographic intelligence can work together to support smarter fundraising.
Contact us to schedule a demo.
Download our flyer for more info
MAKE AN IMPACT
Quantify how your projects are progressing with simple tools that give your company a competitive edge.
MAXIMIZE YOUR DATA
Gather important data while protecting the subject and field team's privacy—and simplify the whole process.
MANAGE YOUR WORKFLOW
At a glance, know the state of your projects, identify what needs to be scheduled, and watch your teams work—all in real-time.
COMMUNICATE
EFFECTIVELY
Use your private data to improve decision-making and keep your team at work. Implement a personalized and interactive story board to visually display your organizations challenges goals, and success.